Data Center
Housing Market Data
Downloadable Housing Market Data From Redfin
Redfin is a real estate brokerage, meaning we have direct access to data from local multiple listing services, as well as insight from our real estate agents across the country. That’s why we’re able to give you the earliest and most reliable data on the state of the housing market. We publish existing industry data faster, and offer additional data on tours and offers that no one else has. Using the tools below, you can visualize and download housing market data for metropolitan areas, cities, neighborhoods and zip codes across the nation. You may learn how to use the tools in this video tutorial.
Redfin Weekly Housing Market Data
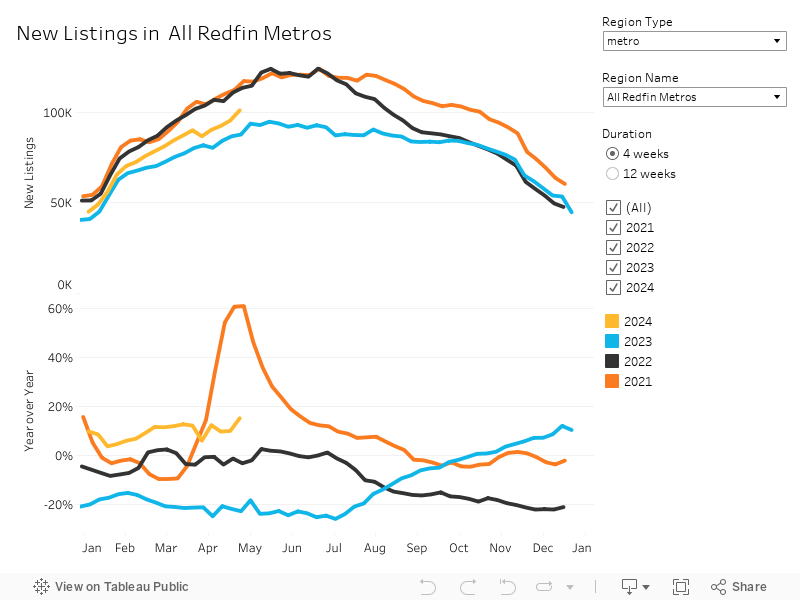
This weekly data will be updated every Wednesday with new data for the prior week.
All data here is computed daily as either a rolling 1, 4 or 12-week window. The local data is grouped by metropolitan area and by county. All of this data is subject to revisions weekly and should be viewed with caution. If there are any concerns about the data or questions about metric definitions, please e-mail econdata@redfin.com or press@redfin.com. You can download the full dataset here. For more information, we’ve compiled all the definitions for each metric.
Redfin Monthly Housing Market Data
To view additional housing market data at the local level, please visit our U.S. Housing Market Overview page here: https://www.redfin.com/us-housing-market
How it Works
- Select the tab for the type of data that you’re looking for. Under each tab, you can filter results by metropolitan area, property type, month-over-month change, year-over-year change, and the time period. Each visualization will change with your selections.
- After making your selections, click on the visualization and then hit the download button on the bottom right corner to get the data shown.
- Alternatively, you can select the “Download” tab and download all of the data that we have available.
- Contact econdata@redfin.com if you have questions.
- Download region data here: National, Metro, State, County, City, Zip Code, Neighborhood
New data will be released monthly during the Wednesday of the third full week of the month. See the latest Redfin reports about monthly housing market performance.
Redfin Existing Home Sales
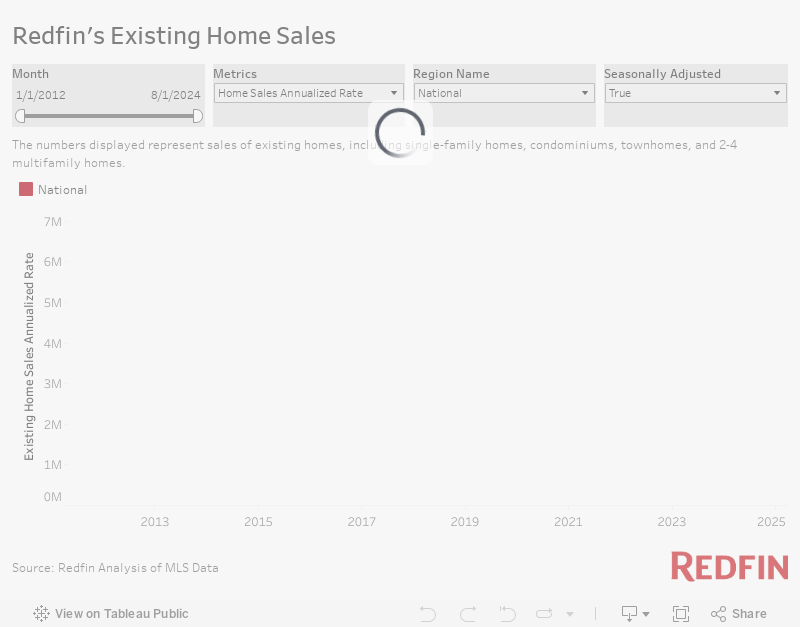
Redfin’s existing home sales data are stated as an annual rate, both seasonally adjusted and non-seasonally adjusted. These data are updated monthly on the Wednesday of the third full week of the month for the previous month.
The Redfin Home Price Index (RHPI)
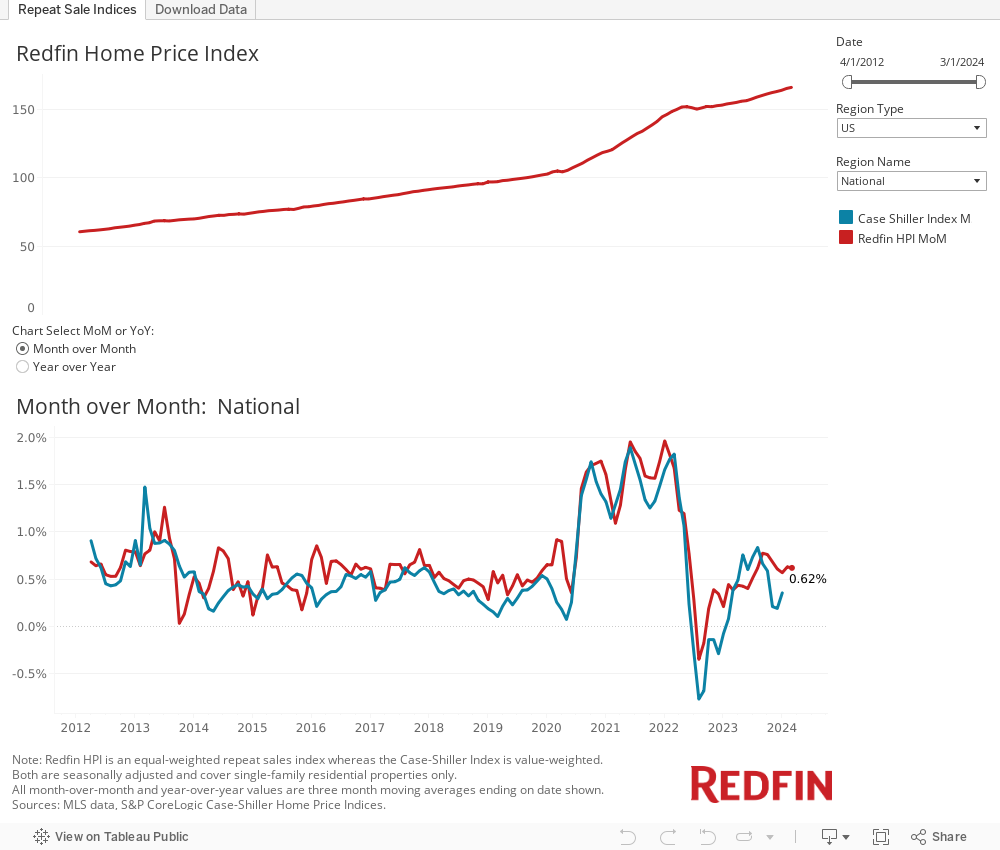
The Redfin Home Price Index (RHPI) uses the repeat-sales pricing method to calculate how sale prices of single-family homes change over time. It measures sale prices of homes that sold during a given period, and how those prices have changed since the last time those same homes sold. The RHPI is seasonally adjusted and weights all home sales equally. It is published on the second-to-last Tuesday of every month. Click here for the full RHPI methodology.
Guidelines for Using this Data
You are welcome to use this data for your own purposes, we just ask that you cite the source. Please include proper citation and link to Redfin for the first reference on a page, post, or article.
For example:
- According to Redfin, a national real estate brokerage, …
- Data provided by Redfin, a national real estate brokerage.
Thank you and please contact press@redfin.com if you have any questions regarding the use of our data or if you would like to speak to one of our housing market experts.
 United States
 Canada